How to Read a Balance Sheet & Profit & Loss Statement: A Director’s Executive Guide
Risk Mitigation & Solvency

A comprehensive guide for directors and promoters to evaluate audited financial statements, identify structural liquidity traps, interpret operating ratios, and connect accrual P&L numbers with real balance sheet solvency.
"“The Profit & Loss statement tells you how fast the vehicle is traveling; the Balance Sheet tells you how much fuel is in the tank and whether the tires can endure the road.”"
The Four Core Balance Sheet Health Checks
- 1. Working Capital Solvency (Current Ratio): Current Assets divided by Current Liabilities. A ratio between 1.33x and 1.50x ensures the enterprise can comfortably clear its short-term debts.
- 2. Leverage & Solvency (Debt-to-Equity): Total debt obligations divided by tangible shareholder net worth. Ratios exceeding 2.5x trigger high banking risk premiums.
- 3. Quality of Receivables: Scrutinizing debtors aging beyond 180 days to identify disputed invoices requiring formal provisioning or write-offs.
- 4. Contingent Liabilities Disclosures: Inspecting footnote disclosures regarding disputed tax demands, customs litigation, and corporate bank guarantees.
Connecting P&L Performance to the Balance Sheet
Healthy financial management connects every rupee of operating EBIT to tangible balance sheet wealth creation: expanding shareholder equity, paying down high-cost term debt, and accumulating liquid cash reserves.
📋 Professional Practice Advisory Note
Lav K Sharma & Co., Chartered Accountants delivers specialized Virtual CFO advisory, corporate debt structuring, statutory audit management, and direct tax compliance across India. For confidential consultation with our partners, connect directly with our office.
The 13-Week Rolling Cash Flow Forecast
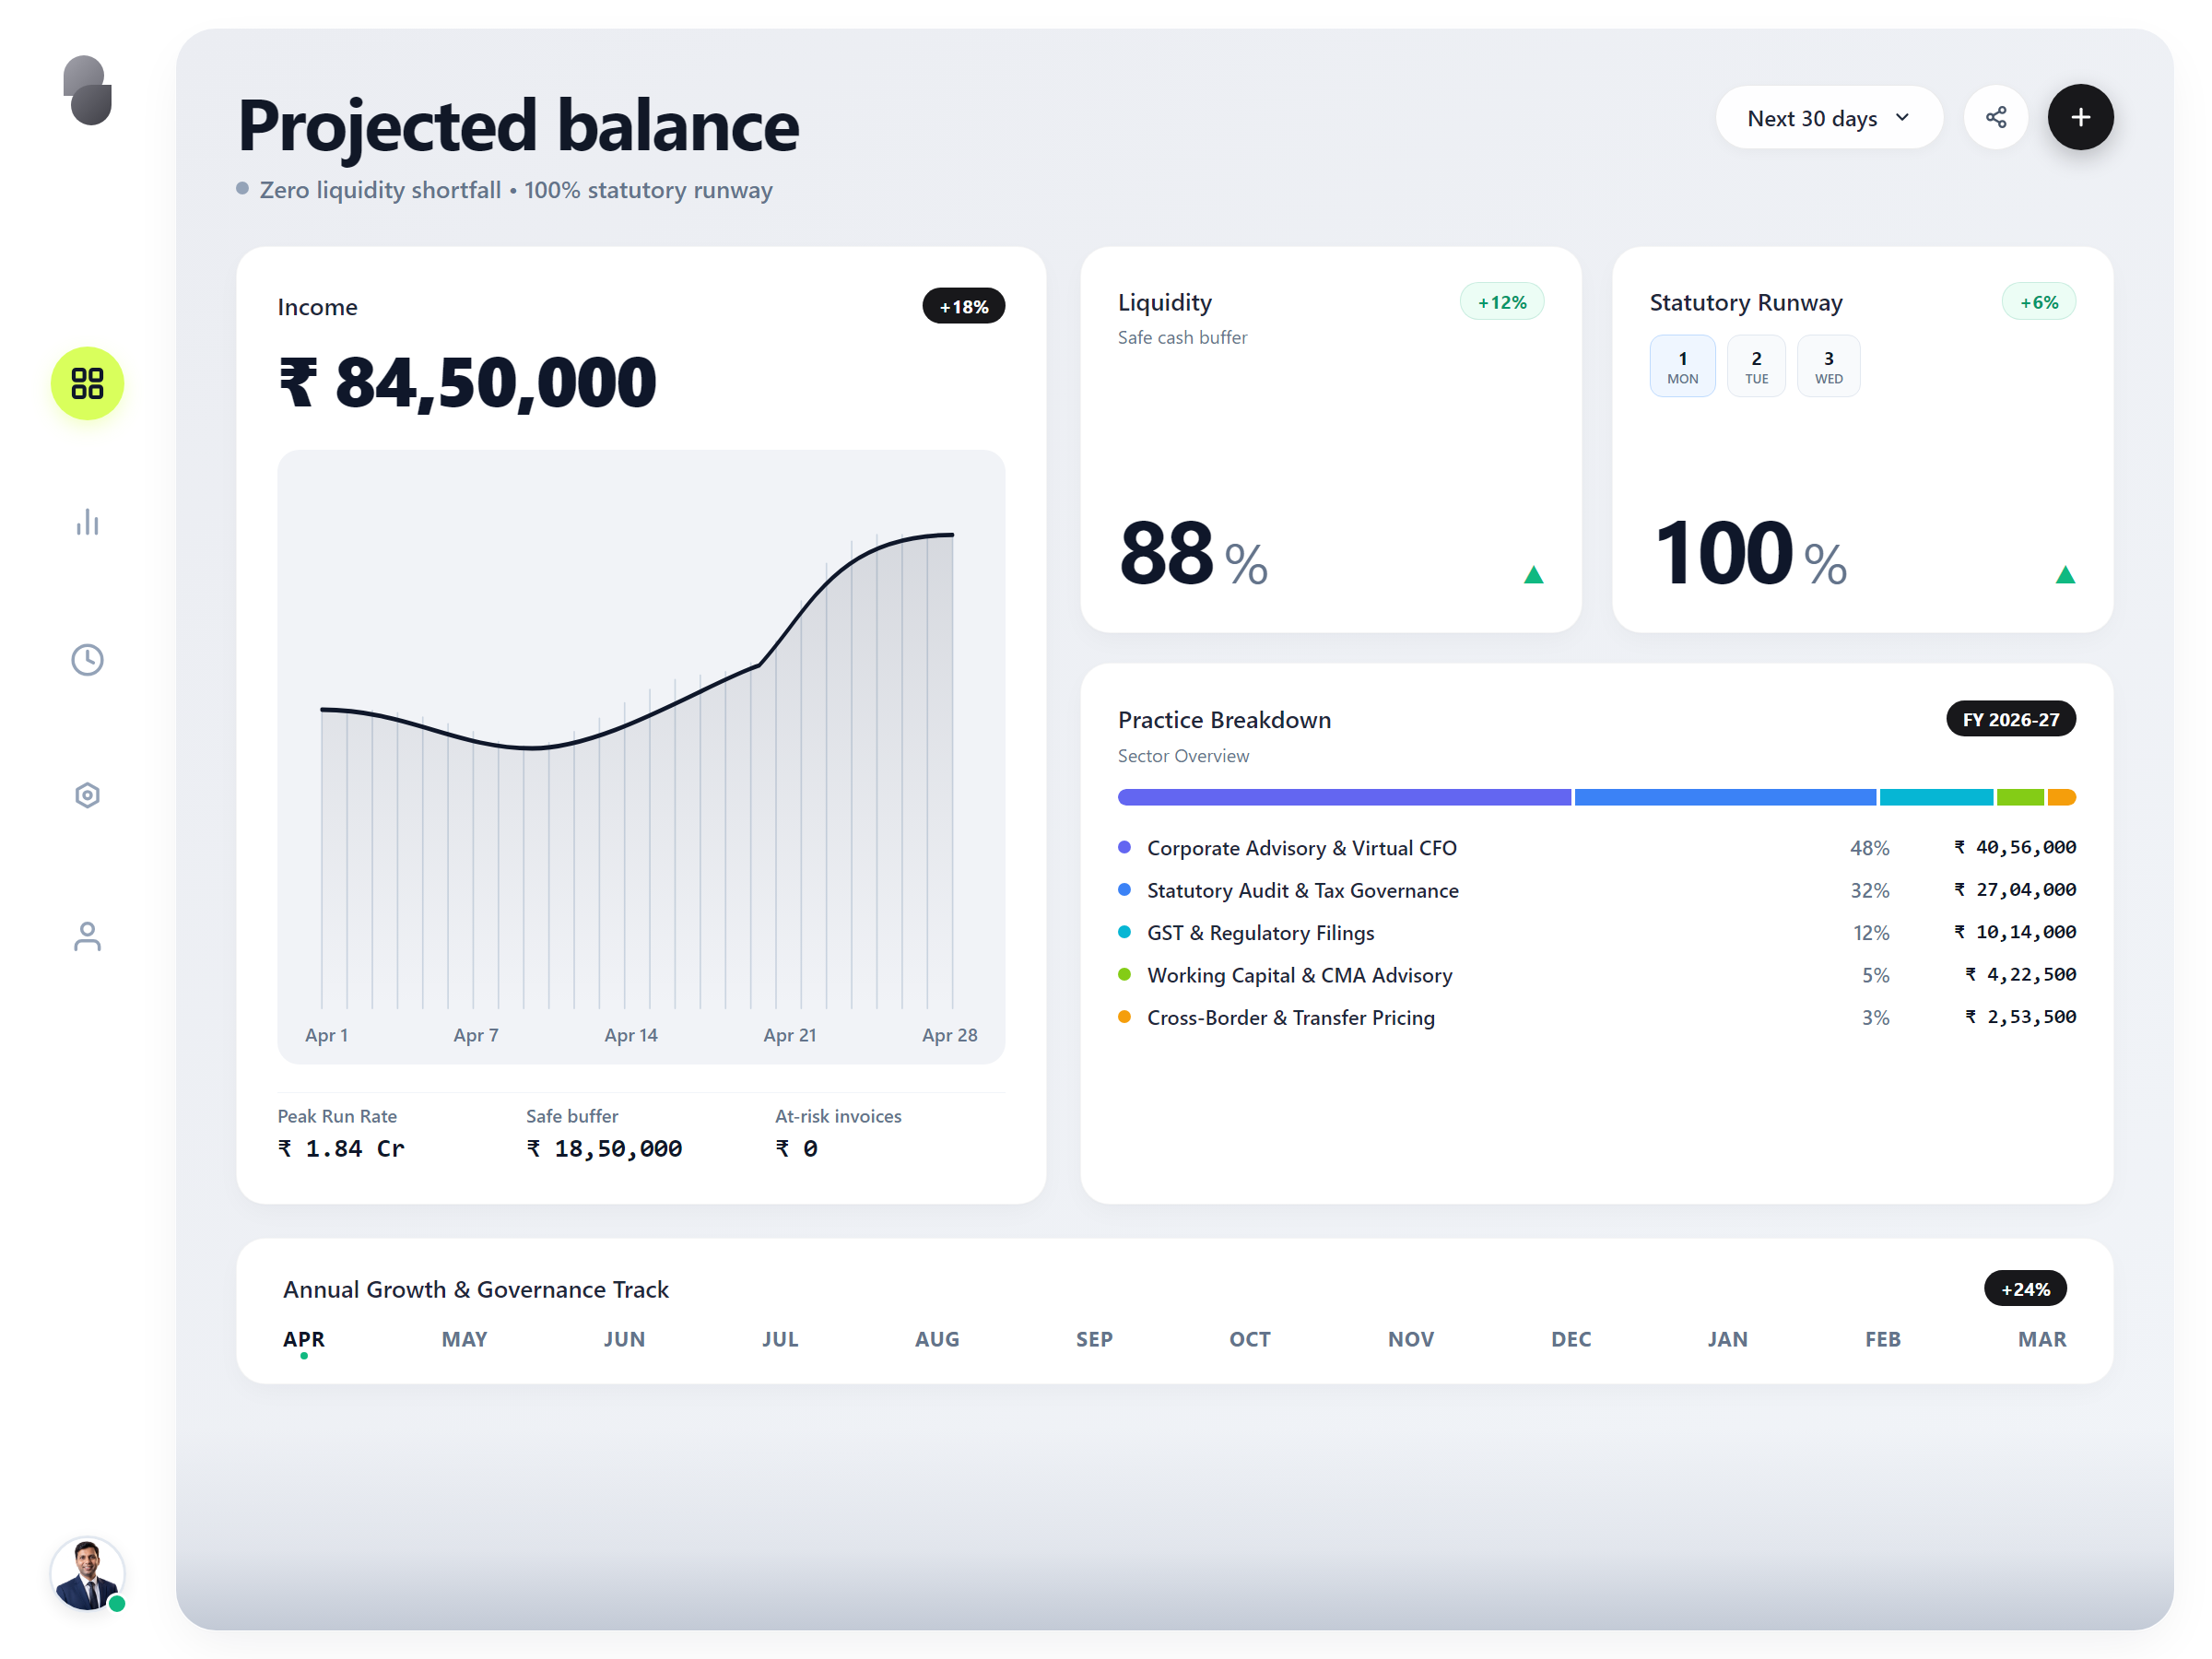
Annual budgets are insufficient for managing working capital volatility. Well-run corporate finance desks rely on a rolling 13-week cash flow model updated every Monday morning:
- Weeks 1 to 4 (Deterministic): Known customer collection commitments, confirmed payroll obligations, statutory tax liabilities, and fixed vendor payouts.
- Weeks 5 to 8 (Operational): Anticipated project billing milestones, scheduled raw material purchases, and advance tax tranches.
- Weeks 9 to 13 (Strategic): Projected seasonal sales inflows and planned capex disbursements.
By rolling this 13-week projection forward each week, a liquidity shortfall is visible 8 to 10 weeks in advance—providing ample runway to adjust procurement, accelerate debtor recovery, or arrange promoter loans.
See also



Strategic Financial Leadership & Advisory
Lav K Sharma & Co. delivers Virtual CFO leadership, corporate tax planning, and statutory compliance discipline to growing enterprises across India.